Wireshark is one of the most powerful and widely used network protocol analyzers. Whether you’re troubleshooting network issues, analyzing performance, or detecting security threats, Wireshark is an indispensable tool for cybersecurity.
What is Wireshark?
Wireshark is a free, open-source tool that allows you to capture and analyse network traffic in real time. It provides a granular view of network activity, breaking down packets into detailed information about protocols, IP addresses, ports, and more.
Key Features:
- Real-time traffic capture and analysis
- Deep inspection of hundreds of protocols
- Support for live capture and offline analysis
- Customizable filters for targeted packet inspection
- Export options for detailed reports
How to Set Up Wireshark
Step 1: Download and Install
- Visit the Wireshark download page.
- Select the version for your operating system (Windows, macOS, or Linux).
- Follow the installation prompts. On Windows, you’ll be prompted to install Npcap (a packet-capturing library) — make sure to allow it.
Step 2: Configure Permissions
On Linux and macOS, you might need to run Wireshark as a superuser to capture packets. Alternatively, configure it to allow non-root users to capture packets for enhanced security.
Step 3: Set Up Capture Interfaces
Launch Wireshark and choose the appropriate network interface for capturing traffic. For example:
- Ethernet for wired networks
- Wi-Fi for wireless networks

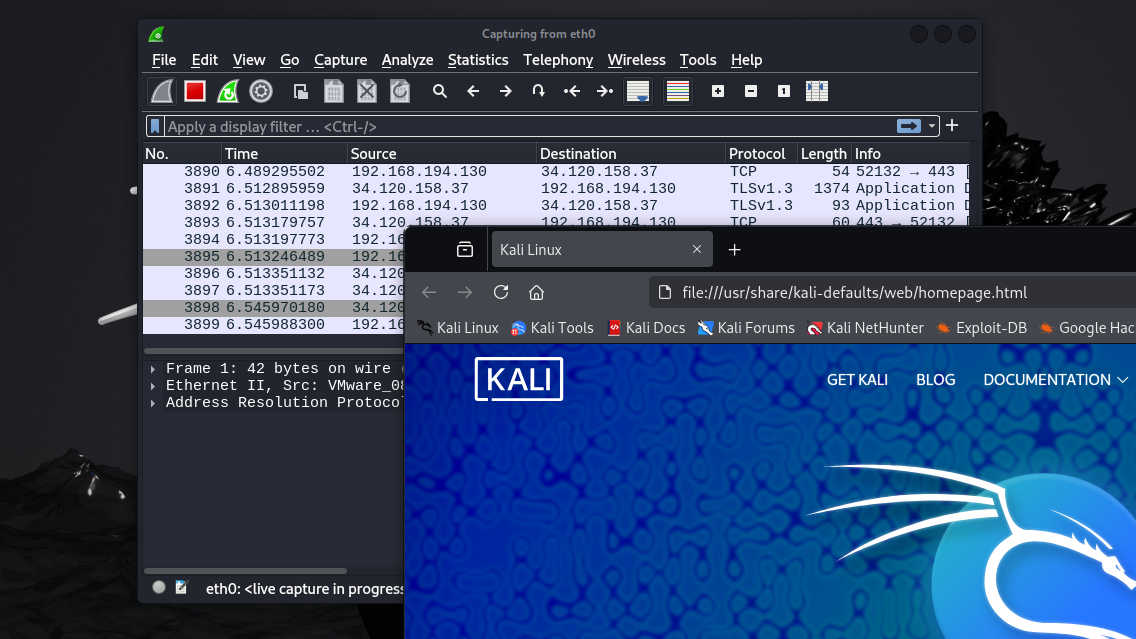
Once you launch your web browser, you should see activitiy on wireshark.
Using Wireshark
Loading PCAP Files
Any saved pcap files you will see at the top of wireshark when you open it up.
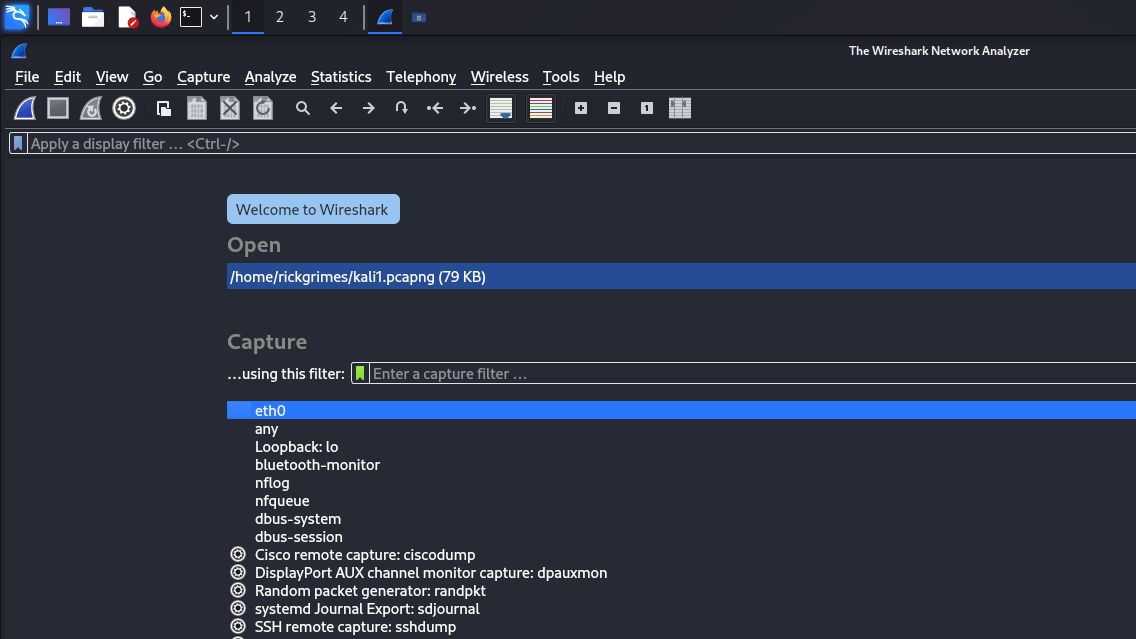
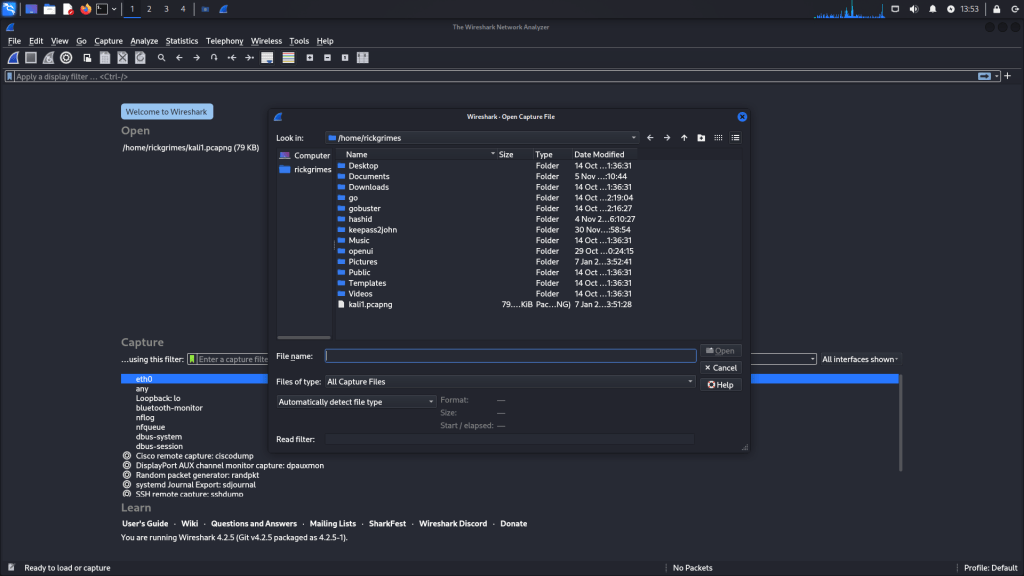
You can open a file by going to –> file –> open. Then find your file name.

Traffic Sniffing
You can initiate network sniffing (traffic capture) by pressing the blue “shark button.” The red button will halt the sniffing process, while the green button will restart it. The status bar will display the sniffing interface in use and the number of packets collected.

Capture File Properties
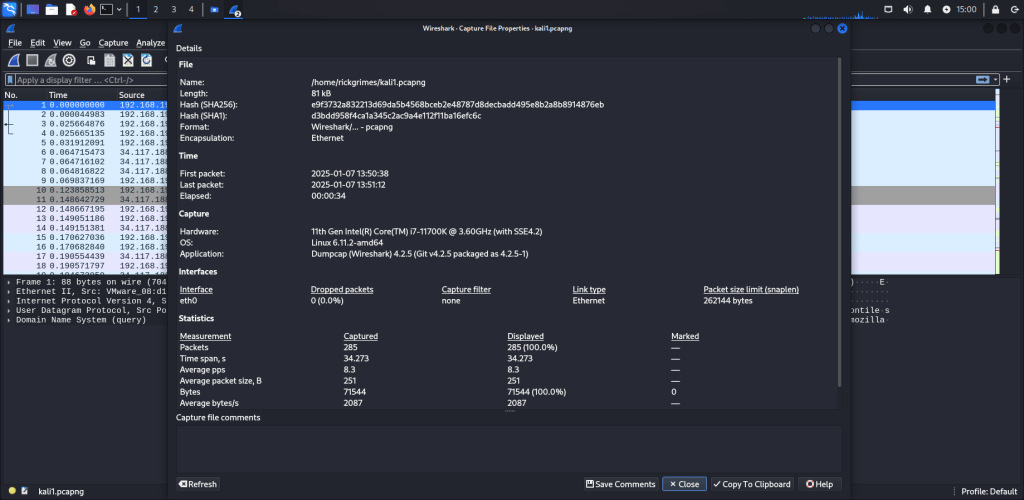
This will show general information about the current capture file.
Details
Notable information about the capture file.
File
Information about the capture file, including its full path, size, cryptographic hashes, file format, and encapsulation.
Time
The timestamps of the first and the last packet in the file along with the elapsed time.
Capture
Details about the capture environment are displayed only during live captures or if the information is included in a saved capture file. This feature is supported by the pcapng format but not by the pcap format.
Interfaces
Information about the capture interface or interfaces.
Statistics
A statistical overview of the capture file is provided. When a display filter is applied, the Captured column will show values, and if packets are marked, the Marked column will display corresponding values. The Captured column values remain unchanged, while the Displayed column values update to reflect the packets currently shown. The Marked column values correspond to the marked packets.
Capture file comments
Some capture file formats (notably pcapng) allow a text comment for the entire file. You can view and edit this comment here.
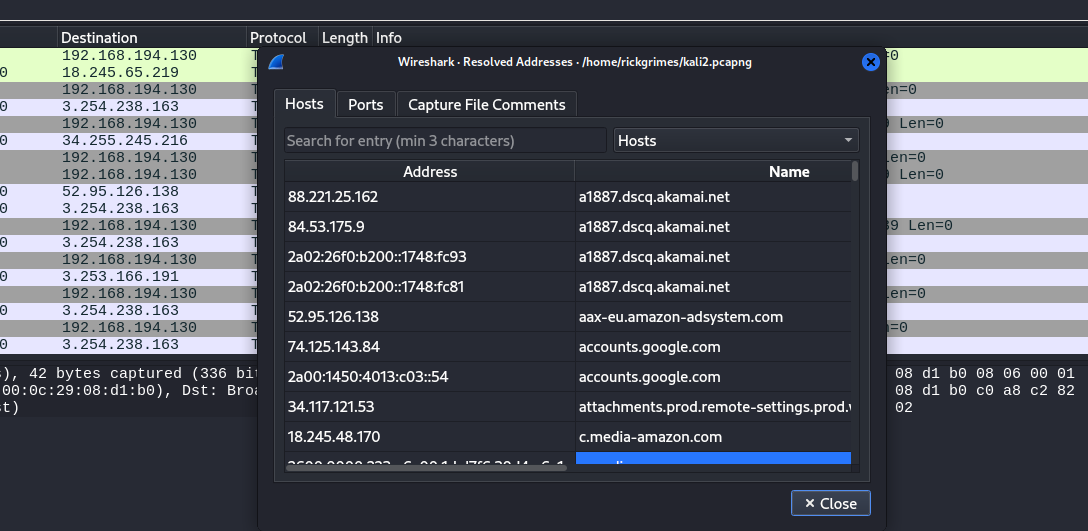
Resolved Addresses
The Resolved Addresses window displays a list of resolved addresses along with their corresponding hostnames. Users can select the Hosts field to show only IPv4 and IPv6 addresses. In this mode, the dialog shows hostnames for each IP address in the capture file that has a known host, typically derived from DNS responses within the file. For IP addresses with unknown hostnames, users can populate the information by performing a reverse DNS lookup.
conversations:
A network conversation is the traffic between two specific endpoints. For example, an IP conversation is all the traffic between two IP addresses.


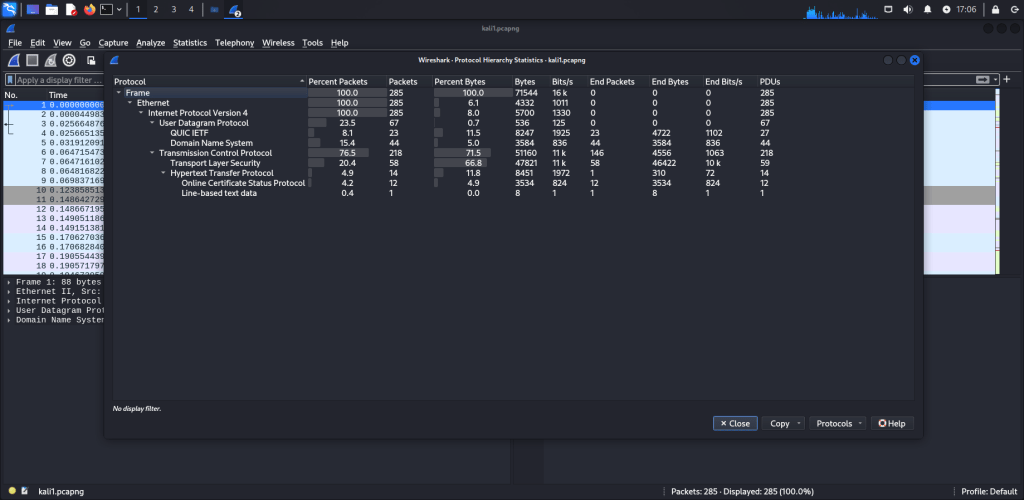
protocol hierarchy of the captured packets:
This is a hierarchical tree displaying all the protocols present in the capture. Each row includes statistical data for a specific protocol. Two of the columns, Percent Packets and Percent Bytes, also function as bar graphs. If a display filter is applied, it will be shown at the bottom of the window. The Copy button will let you copy the window contents as CSV or YAML.
Protocol hierarchy columns
Protocol
Protocol’s name.
Percent Packets
The percentage of protocol packets relative to all packets in the capture.
Packets
The total number of packets that contain this protocol.
Percent Bytes
The percentage of protocol bytes relative to the total bytes in the capture.
Bytes
The total number of bytes of this protocol.
Bits/s
The bandwidth of this protocol relative to the capture time.
End Packets
The absolute number of packets of this protocol where it was the highest protocol in the stack (last dissected).
End Bytes
The absolute number of bytes of this protocol where it was the highest protocol in the stack (last dissected).
End Bits/s
The bandwidth of this protocol relative to the capture time where was the highest protocol in the stack (last dissected).
PDUs
The total number of PDUs of this protocol.
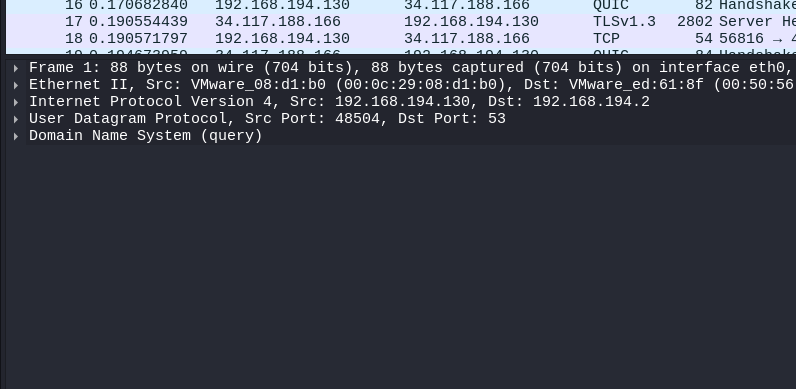
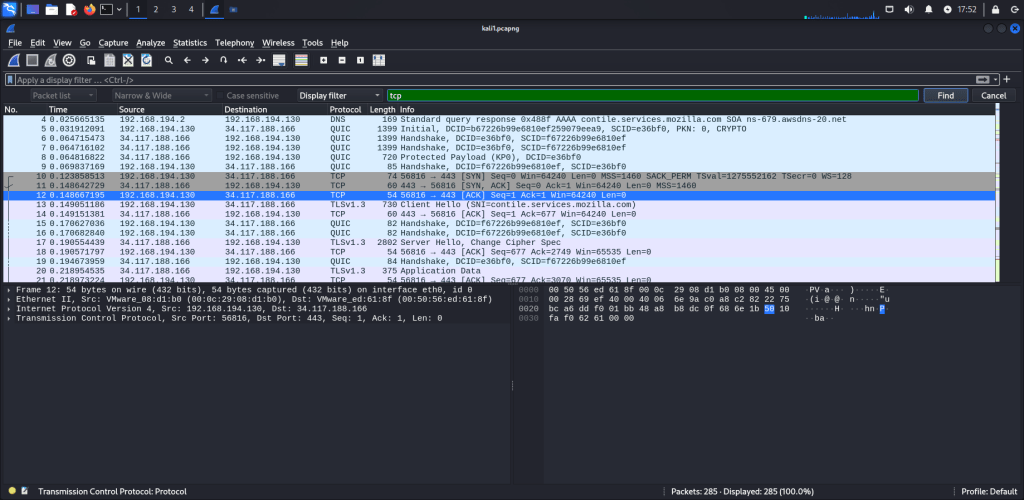
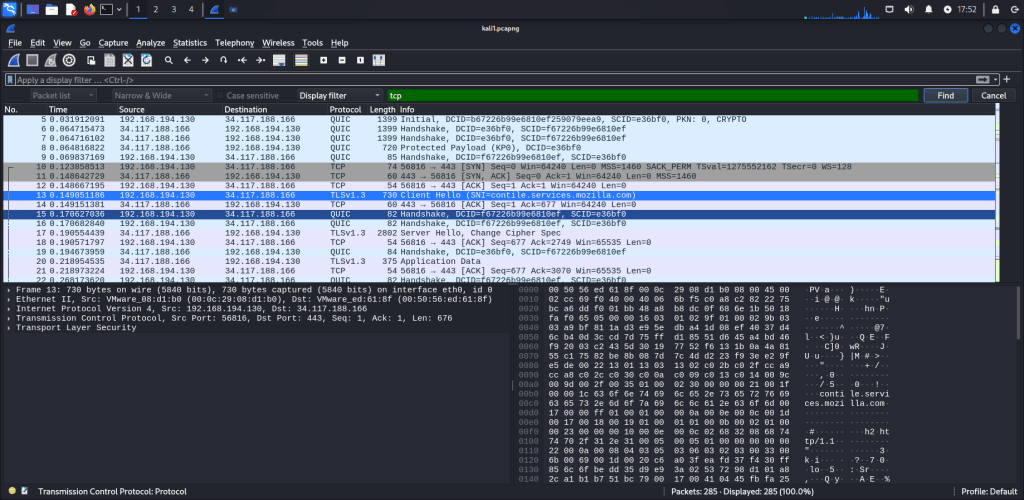
Packet Dissection:
Packet dissection, also referred to as protocol dissection, involves analyzing packet details by decoding the available protocols and their fields. Wireshark supports an extensive list of protocols for this purpose.
Go to Packet:
Packet numbers serve more than just counting the total number of packets or aiding in locating and analyzing specific packets. This feature not only allows navigation between packets but also supports in-frame packet tracking and helps identify the next packet in a specific part of a conversation. You can access the “Go” menu and toolbar to view particular packets.


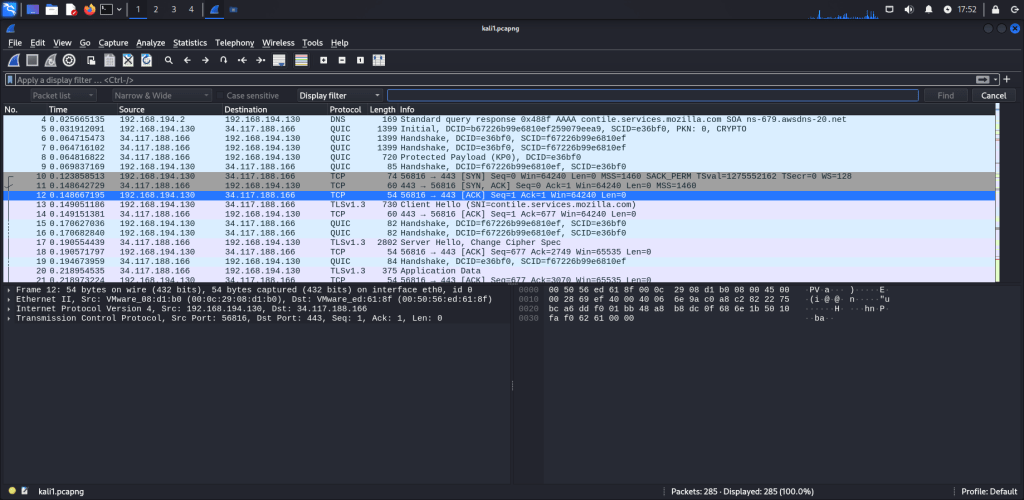
Find Packets
Wireshark can search for packets based on their content. By using the “Edit –> Find Packet” menu, you can search within packets for specific events of interest. This feature assists analysts and administrators in identifying particular intrusion patterns or failure traces.
There are two key aspects to finding packets. The first is understanding the input type. This feature supports four types of inputs: Display filter, Hex, String, and Regex. Among these, String and Regex searches are the most frequently used. By default, searches are case insensitive, but you can enable case sensitivity by selecting the appropriate radio button.
The second point is selecting the appropriate search field. You can perform searches in the three panes: packet list, packet details, and packet bytes. It’s essential to understand the type of information available in each pane to locate the event of interest effectively. For instance, if you search for information present in the packet details pane but conduct the search in the packet list pane, Wireshark will not find it, even if the data exists.
Packet Comments
Similar to packet marking, commenting is another useful feature for analysts. You can add comments to specific packets to aid in further investigation or to highlight important or suspicious points for other analysts. Unlike packet marking, comments remain in the capture file until they are manually removed by the user.

Packet Filtering
Wireshark features a robust filter engine that allows analysts to narrow down traffic and concentrate on specific events of interest. It offers two types of filtering methods: capture filters and display filters. Capture filters are applied during the packet capture process to collect only the packets that match the specified filter criteria. Display filters, on the other hand, are used to view only the packets that meet the filter criteria within an already captured set of data.
Filters are specialized queries tailored for protocols listed in Wireshark’s official protocol reference. While filters are essential for investigating events of interest, there are two primary methods to filter traffic and eliminate noise from a capture file. The first method involves using queries, and the second utilizes the right-click menu. Wireshark offers a highly intuitive GUI.

Apply as Filter
This is the simplest method for filtering traffic. While analyzing a capture file, you can click on the field you wish to filter and use the “right-click menu” or the “Analyse –> Apply as Filter” option to filter by that specific value. Once the filter is applied, Wireshark will automatically generate the necessary filter query, apply it, and display only the packets that match your selection, hiding the rest from the packet list pane. Keep in mind that the total number of packets and the number of displayed packets are always visible on the status bar.
Conversation filter
When you use the “Apply as a Filter” option, it filters only a single element within the packet. This method is useful for examining a specific value in packets. However, if you want to investigate a particular packet number and all associated packets by focusing on IP addresses and port numbers, the “Conversation Filter” option allows you to view only the related packets while hiding the rest. You can access this feature through the “right-click menu” or the “Analyse –> Conversation Filter” menu to filter conversations.
Apply as Column
By default, the packet list pane displays basic information for each packet. You can add columns to this pane by using the “right-click menu” or the “Analyse –> Apply as Column” option. When you select a value and apply it as a column, it will appear in the packet list pane. This feature allows analysts to track the presence of a specific value or field across all packets in the capture file. You can enable or disable the columns shown in the packet list pane by clicking on the headers at the top of the pane.
Follow Stream
Wireshark presents data in packet-sized portions, but it also allows you to reconstruct streams and view raw traffic as it appears at the application level. By following protocol streams, analysts can recreate application-level data and gain a clearer understanding of the event of interest. This process also enables the viewing of unencrypted protocol data, such as usernames, passwords, and other transmitted information. You can access this feature via the “right-click menu” or the “Analyse –> Follow TCP/UDP/HTTP Stream” option. Streams are displayed in a separate dialog box, with server-originated packets highlighted in blue and client-originated packets highlighted in red. When you follow a stream, Wireshark automatically generates and applies the necessary filter to display the specific stream. Keep in mind that applying a filter changes the number of visible packets.
Colouring Packets
Wireshark colours packets based on various conditions and protocols to help quickly identify anomalies and specific protocols within captures. This visual representation of packet information can streamline the analysis process, making it easier to locate what you’re searching for. You can also create custom color rules using display filters to highlight events of interest during your analysis.
Wireshark offers two types of packet coloring methods: temporary rules, which are only active during the current program session, and permanent rules, which are saved in the preference file (profile) and remain available for future sessions. You can create permanent coloring rules using the “right-click menu” or the “View –> Coloring Rules” option. The “Colours Packet List” menu allows you to enable or disable these coloring rules. Temporary packet coloring can be applied using the “right-click menu” or the “View –> Conversation Filter” option.
Wireshark Modes
Wireshark offers several modes to tailor the capture and analysis process:
Promiscuous Mode
Captures all packets on the network, not just those addressed to your device. Useful for analyzing overall network traffic.
Monitor Mode (Wi-Fi only)
Captures raw wireless traffic, including packets not connected to your network. Not all devices support this. If your adapter does, enable it in the interface options. Great for wireless network troubleshooting and detecting rogue devices.
Common Use Cases for Wireshark
1. Troubleshooting Network Issues
Identify bottlenecks, latency, or dropped packets. Use display filters to pinpoint specific issues.
2. Security Analysis
Detect anomalies such as unauthorized devices or malicious traffic patterns.
3. Protocol Analysis
Understand how protocols like HTTP, DNS, or TLS operate within your network.
4. Bandwidth Monitoring
Determine which devices or applications consume the most bandwidth.
Wireshark is a great tool for any pentester or a hobbiest. If you are learning more about how networks function, Whether you’re debugging a slow connection or investigating security incidents, wireshark is definitely a tool you want in your bag.


Leave a comment